
Rising three methods and falling three methods
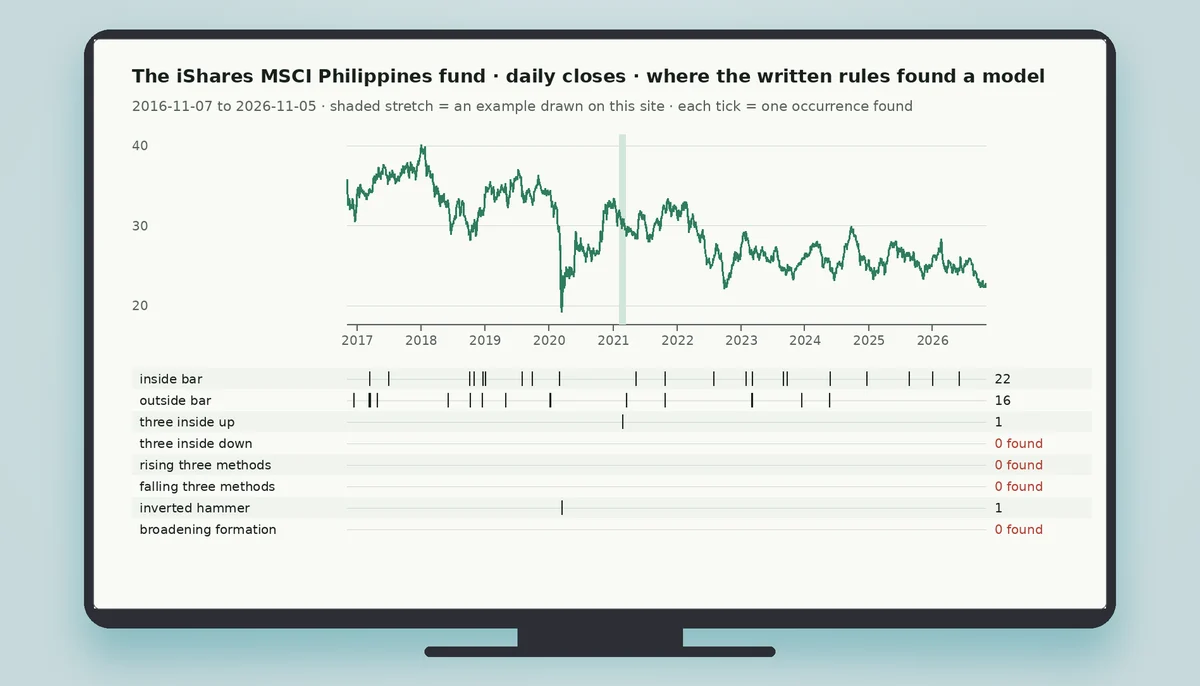
Rising three methods and falling three methods are continuation patterns: a long candle, a short pause of three small candles inside its range, and a long candle that resumes the trend. This page has no chart, and that is the finding: in ten years of daily bars on the Philippines fund, the PLDT ADR and gold futures, the written rules for both found none.
What defines the pattern
The pattern begins with a long candle in the direction of the trend. Rule RM-1 (rising three methods) makes that an up candle with a body of at least 1.2 ATR, where ATR is the average true range of the last 14 sessions. Then come exactly three candles with bodies of at most 0.5 ATR that stay inside the first candle's high-low range, the third closing below the first of the three. The fifth candle is an up candle with a body of at least 1 ATR that closes above the first candle's close. The pattern must come after a rise: the close before it stands at least 3 ATR above the lowest close of the 10 sessions ending there. It counts as formed when the fifth candle closes.
Rule RM-2 (falling three methods) is the mirror image: a long down candle, three small candles inside its range, the third closing above the first of the three, and a down candle that closes below the first candle's close, after a fall. The rule is strict: the small candles must stay inside the first candle's range, and there must be three of them.
What the small candles represent
The small candles represent a pause in the trend. They move against the trend, but they do not go far enough to break the first candle's range. They are read as profit-taking or hesitation, not as a reversal. The small candles are a rest, and the final candle resumes the trend.
The small candles give the pattern its name, the three methods, and the written rule asks for exactly three. What matters is that they stay inside the first candle's range and that they are followed by a long candle in the original direction. The small candles are a pause, not a turn.
How it differs from a reversal
A reversal pattern signals that the trend is changing direction. A continuation pattern signals that the trend is pausing and then resuming. Rising three methods and falling three methods are continuation patterns because the final candle resumes the original trend. The small candles against the trend are a pause, not a reversal.
The difference is the final candle. In a reversal pattern, the final candle would be in the opposite direction of the first candle. In these patterns, the final candle is in the same direction as the first candle, and it closes beyond the first candle's close. The pattern is a continuation, not a reversal.
Where the pattern fails
The pattern can fail if the small candles break out of the first candle's range. If the small candles move beyond the first candle's close, the pattern is not valid, and the pause may have turned into a reversal. The pattern also fails if the final candle does not close beyond the first candle's close: the trend has not resumed, and the pattern is incomplete.
A failed pattern is common: the final candle may close beyond the first candle's close, but the next candle may reverse and take price back. The pattern describes what price has already done; it does not predict what it will do next.
Why this page has no chart
Rule RM-1 (rising three methods) and rule RM-2 (falling three methods) were run over every daily bar of the iShares MSCI Philippines fund (EPHE), the PLDT ADR (PHI) and gold futures (GC=F), from 7 November 2016 to 5 November 2026. They found no occurrence on any of the three. The rules were not loosened to produce one and nothing is drawn by hand.
The shape is a stack of conditions across five sessions: a first body of at least 1.2 ATR, exactly three small bodies of at most 0.5 ATR inside the first range, a closing sequence among the small candles, and a fifth body of at least 1 ATR that closes beyond the first close, after a 3 ATR move over 10 sessions. A shape this specific may simply not occur on three series in a decade. The page cannot say whether the cause is the rule or the markets, and it claims neither. It says what was measured: zero.
Patterns describe, they do not predict
Rising three methods and falling three methods are descriptions of what price has already done: a long candle, a pause, and a long candle that resumes the trend. They are not forecasts of what price will do next. The patterns do not say that the trend will continue, and they do not say how far it will go. They only say that the trend has resumed.
A reader who sees these patterns on a chart should read them as pauses, not as signals. The patterns are useful ways to see where price has rested, but the next move is not written in the patterns. The patterns describe; they do not predict.
Checking the zero yourself
Pick a daily chart of gold futures, the Philippines fund or the PLDT ADR and look for a long up candle followed by three small candles that stay inside its range. Then apply rule RM-1: the first body at least 1.2 ATR; three bodies of at most 0.5 ATR inside the first candle's high-low range, the third closing below the first of the three; and a fifth up candle with a body of at least 1 ATR that closes above the first candle's close, after a rise of 3 ATR over 10 sessions. The falling version is the mirror.
It is easy to find a long candle and a pause. It is much harder to find a pause of exactly three small candles that never leave the first candle's range and then a resuming candle that closes beyond the first close.
Why a continuation pattern needs more conditions
Reversal patterns on this site, such as three inside up, ask that one candle turn the next. A continuation pattern like three methods asks for something subtler: a pause that does not break the first candle and a resumption that clears it. The rule has to say how small is small, how many candles make a pause, and how far the resumption must go, and each answer is a number that removes cases.
The result on these three series was zero in ten years. Whether that means the shape is rare, or that markets pause in less tidy ways than the textbook drawing, the page does not say. It says what the rule found.
Reading the empty rows
In the overview picture on the home page the rows for rising and falling three methods are empty, marked 0 found, under the line of the Philippines fund's closes. They sit beside rows that carry dozens of ticks, and the contrast is the lesson of the page: some shapes that look ordinary in a textbook are not ordinary in ten years of real bars read by a strict rule.
Words used on this page
A body is the distance between a candle's open and close; the rule measures it in ATR, the average true range of the last 14 sessions. The first candle sets the range, the three small candles are the pause, and the fifth candle is the resumption. Staying inside means that the high and low of each small candle lie within the first candle's high and low. The first of the three is the second candle of the pattern. The words are few and each has a number, which is what lets a reader check the page.
What this page does not tell you
It does not tell you whether rising or falling three methods are reliable continuation signals, because no occurrence was found. It does not say how many candles a pause may contain in other books, or how other sites define the pause. It says what this site's rule asks, what the three series produced, and when the history was read. Where a reader finds a stretch that fits their own looser definition, nothing here contradicts them; it only says that the stricter written rule did not find one. The date the history was read, 6 November 2026, and the last bar it holds, 5 November 2026, are the two dates that bound the claim; a pattern that appears after them is outside it, and so is any series the site did not read. A reader who runs the rule on a longer history, or on the Philippine listings the source did not serve, is measuring something this page does not cover, and the result may differ without either measurement being wrong. In short, the page's claim is a count under a definition, and it stays true only for that definition, that history and that date.
Three methods at a glance
Read next
Questions about the next-level patterns
Are these patterns continuation or reversal?
These are continuation patterns. The final candle resumes the original trend, so the pattern signals a pause, not a reversal. The small candles against the trend are a rest, not a turn.
How many small candles are required?
The pattern usually has three small candles, but the number can vary from two to four. What matters is that the small candles stay inside the first candle's range and are followed by a long candle in the original direction.
What happens after the pattern?
After the pattern, price may continue in the direction of the trend, or it may fail and reverse. The pattern does not predict the direction or the size of the next move. A failed pattern is common.
Why does this page have no chart?
Rule RM-1 (rising three methods) and rule RM-2 (falling three methods) were run over every daily bar of the iShares MSCI Philippines fund (EPHE), the PLDT ADR (PHI) and gold futures (GC=F), from 7 November 2016 to 5 November 2026. They found no occurrence on any of the three. The rules were not loosened to produce one and nothing is drawn by hand.
Can the small candles break the first candle's range?
No, the small candles must stay inside the first candle's range for the pattern to be valid. If they break out, the pattern is not valid, and the pause may have turned into a reversal.
A chart is not an order
The patterns on this site are drawn on real price history, but an order is placed on a trading platform. This site links to an international broker where you can open an account and trade gold, currency pairs and share indices as contracts for difference.