
The broadening formation
The broadening formation is a series of price swings that keep widening, a megaphone: each high above the last, each low below the last. This page has no chart, and that is the finding: in ten years of daily bars on the Philippines fund, the PLDT ADR and gold futures, the written rule for the broadening formation found none.
What defines a broadening formation
The broadening formation is a series of price swings that expand. Each swing high is higher than the previous swing high, and each swing low is lower than the previous swing low. The pattern looks like a megaphone: two diverging trendlines, one connecting the rising highs and one connecting the falling lows. The pattern can appear after a rise or after a fall, and it can break out in either direction.
The pattern is defined by the widening swings. The trendlines are drawn after the fact, connecting the highs and lows that the market has already made. The pattern is not a forecast; it is a description of what price has already done: it has been swinging more widely over time.
The numbers behind the rule: rule BR-1 needs at least two pivot highs and two pivot lows, found with a 2 ATR zigzag, within 20 to 120 sessions; each high at least 1 ATR above the one before and each low at least 1 ATR below the one before, so the lines through them diverge; the gap between the lines at the last pivot at least 1.5 times the gap at the first; and no close more than 0.5 ATR outside either line before the last pivot. It counts as formed only when a session closes outside one of the two lines within 25 sessions after the last pivot. ATR is the average true range of the last 14 sessions.
Why it is read as a sign of an unsettled market
The widening swings show that the market is becoming more volatile. Each move up is met by a larger move down, and each move down is met by a larger move up. The market is not settling into a trend or a range; it is expanding. This is read as a sign of disagreement among traders: bulls and bears are both pushing harder, and neither side is winning.
The broadening formation is often seen at market tops, but it can also appear at bottoms. It is not a reversal pattern; it is a sign of instability. The market is not sure where it wants to go, and the swings are getting wider as the argument continues.
Why it has no reliable textbook direction
Unlike many patterns, the broadening formation does not have a reliable breakout direction. A symmetrical triangle, for example, often breaks in the direction of the prior trend, but a broadening formation can break either up or down. The widening swings mean that the market is testing both higher and lower levels, and the final breakout is not predictable from the pattern alone.
The pattern is often called a megaphone because it gets louder: the swings get wider, and the market is shouting. But the direction of the final move is not written in the pattern. Some traders look for a breakout from the pattern's boundaries, but the boundaries are sloping, and a break can happen at any point.
Why it is hard to trade
The broadening formation is hard to trade because the swings are wide and unpredictable. A trader who tries to trade the swings may be caught by a sudden reversal: a move to a new high can be followed by a sharp drop to a new low. The pattern's boundaries are not horizontal, so stop-loss placement is difficult. A stop placed just beyond a swing high may be hit before the pattern resolves.
The pattern also has no clear entry point. A breakout from the pattern's boundaries can happen at any time, and the direction is not predictable. A trader who waits for a breakout may miss the move, and a trader who enters early may be whipsawed. The broadening formation is a warning sign, not a trading signal.
Why this page has no chart
Rule BR-1 was run over every daily bar of the iShares MSCI Philippines fund (EPHE), the PLDT ADR (PHI) and gold futures (GC=F), from 7 November 2016 to 5 November 2026. It found no occurrence on any of the three. The rule was not loosened to produce one and nothing is drawn by hand.
The rule asks for swings that widen by at least 1 ATR a step, lines whose gap at the last pivot is at least 1.5 times the gap at the first, no close more than 0.5 ATR outside either line, and a closing break within 25 sessions after the last pivot. Widening swings are easy to see on a chart afterwards; meeting every number is another matter. The page cannot say whether the cause is the rule or the markets, and it claims neither. It says what was measured: zero.
Patterns describe, they do not predict
A broadening formation is a description of what price has already done: swings that have been getting wider. It is not a forecast of what price will do next. The pattern does not say which way the market will break, and it does not say when. It only says that the market has been unsettled.
A reader who sees a broadening formation on a chart should read it as a warning sign, not as a signal. The pattern is a useful way to see where volatility is expanding, but the next move is not written in the pattern. The pattern describes; it does not predict.
Checking the zero yourself
Take a daily chart of gold futures, the iShares MSCI Philippines fund or the PLDT ADR and look for a megaphone: swing highs that keep rising and swing lows that keep falling. Then apply rule BR-1: at least two pivot highs and two pivot lows from a 2 ATR zigzag within 20 to 120 sessions; each high at least 1 ATR above the one before and each low at least 1 ATR below; the gap between the lines at the last pivot at least 1.5 times the gap at the first; no close more than 0.5 ATR outside either line before the last pivot; and a closing break of one line within 25 sessions after the last pivot.
Widening swings are common on a volatile stretch, but the last two conditions, no close outside the lines and a break that follows soon, remove most of them.
What the page can and cannot claim
The page claims one thing: under rule BR-1, as written, no broadening formation occurred on these three instruments between November 2016 and November 2026. It does not claim that the formation is rare in other markets, that the megaphone is not a useful description of an unsettled market, or that the rule is the only reasonable one.
The textbook description on this page is kept because readers meet the term and deserve a plain explanation. The measurement on this page is kept next to it so that the explanation is not mistaken for evidence that the figure occurs. The two are different kinds of statement and the page labels each.
Reading the empty row
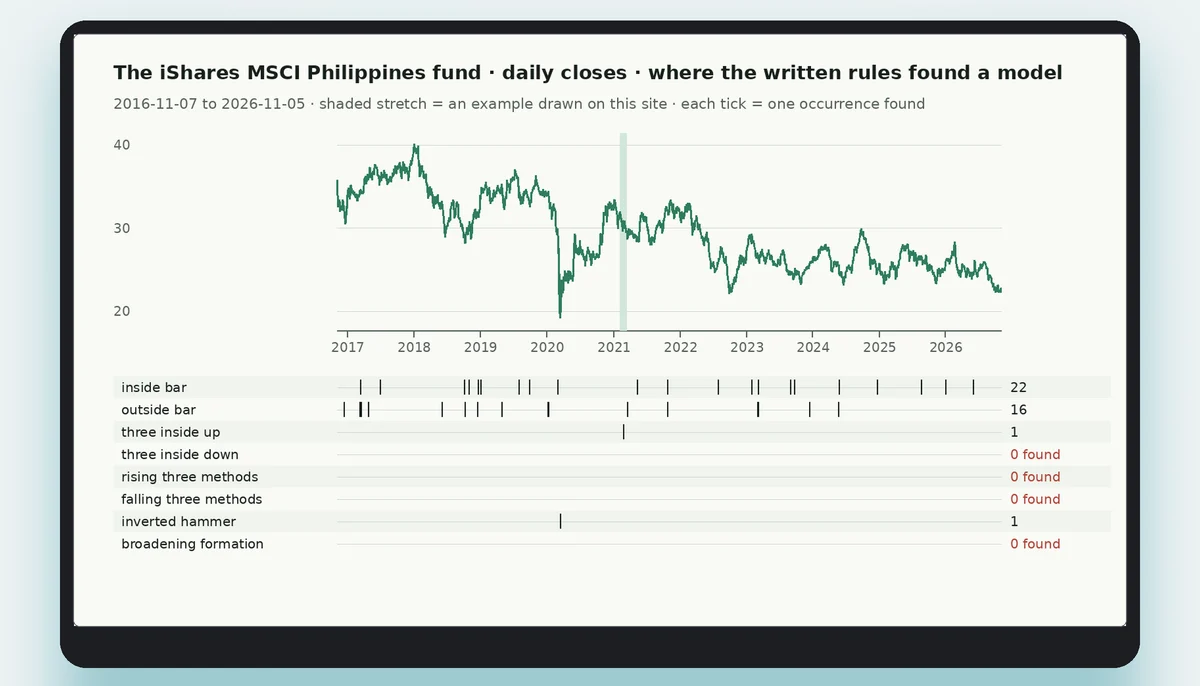
The overview picture on the home page shows the iShares MSCI Philippines fund's closes with one row per model beneath. The row for the broadening formation is empty and marked 0 found, as are the rows for three inside down and for rising and falling three methods. The inside bar and outside bar rows carry dozens of ticks. An empty row is a result, drawn at the same size as the full ones.
Words used on this page
A pivot is a swing high or swing low found by a zigzag of 2 ATR, where ATR is the average true range of the last 14 sessions. A line through the pivot highs and a line through the pivot lows make the two sides of the figure; if the sides diverge, the figure widens. The gap is the vertical distance between the two lines. A break is a close outside one of the lines. Each term maps to a number in the rule above, so a reader can reproduce the test on any series without relying on the eye.
What this page does not tell you
It does not tell you whether a broadening formation signals a top, a bottom or neither, because no occurrence was found to look at. It does not tell you how traders in the Philippines or anywhere else should trade the figure. It tells you the rule, the three instruments, the dates of the history and the count, which is zero. The textbook description above is kept so that a reader who meets the word has a plain explanation, and the measurement is kept beside it so that the explanation is not read as evidence. The date the history was read, 6 November 2026, and the last bar it holds, 5 November 2026, are the two dates that bound the claim; a formation that appears after them is outside it.
Broadening formation at a glance
Read next
Questions about the next-level patterns
Is a broadening formation bullish or bearish?
A broadening formation has no reliable direction. It can break out either up or down. It is a sign of an unsettled market, not a forecast of the next move.
Why is it called a megaphone?
It is called a megaphone because the swing highs and lows form two diverging lines that look like a megaphone. The swings get wider, like a megaphone getting louder.
Can a broadening formation appear at a bottom?
Yes, a broadening formation can appear at a bottom as well as at a top. It is not a reversal pattern; it is a sign of instability. The market is not sure where it wants to go.
How do you trade a broadening formation?
It is hard to trade because the swings are wide and unpredictable. There is no clear entry point, and stop-loss placement is difficult. Many traders avoid it or wait for a clear breakout.
Why does this page have no chart?
Rule BR-1 was run over every daily bar of the iShares MSCI Philippines fund (EPHE), the PLDT ADR (PHI) and gold futures (GC=F), from 7 November 2016 to 5 November 2026. It found no occurrence on any of the three. The rule was not loosened to produce one and nothing is drawn by hand.
A chart is not an order
The patterns on this site are drawn on real price history, but an order is placed on a trading platform. This site links to an international broker where you can open an account and trade gold, currency pairs and share indices as contracts for difference.