
A plain guide to the inside bar and its kin.
The hammer and the doji are only the first rank. This guide walks through six less-written-about patterns that the written rules looked for on a Philippines fund, a Philippine company's US-listed shares and gold, and tells you exactly what each one is, where it fails, and what it does not promise.
How a page here is built
Every pattern page opens with a chart drawn from real daily bars, directly under the heading. A hollow candle closed above its open and a filled one closed below it; the pale band is the figure; the labelled circles mark the points the rule used. A caption under the chart names the instrument, the source and the date the history was read, and says how many occurrences the rule found in ten years.
Under the chart the page defines the pattern in plain words, repeats the definition in the rule's own numbers, and says where the pattern fails and what it cannot tell a reader. Four of the eight pages end with a finding instead of a chart, because the written rule found nothing to draw, and the page says so. No page publishes a signal, a target or a score, and none says what price will do next.
Three instruments, none of them a Philippine index
This guide set out to draw patterns on Philippine markets, and the source did not cooperate. The Philippine stock exchange index, the PSEi, was not served at all, and the main Philippine listings, BDO, SM Investments, Ayala Land and PLDT's local shares, returned errors. What the site could read is three series with real open, high, low and close for every session: the iShares MSCI Philippines fund (EPHE), the PLDT American depositary receipt (PHI) and COMEX gold futures.
The fund holds Philippine shares and trades in the United States, in dollars. The ADR is a receipt for a Philippine company's shares, also traded in the United States. Gold futures are the one series that is not Philippine at all. Each chart names its instrument, and the site makes no claim that these three stand for the Philippine market. They are what the data allowed, 2,513, 2,513 and 2,437 bars from 7 November 2016 to 5 November 2026.
Eight models, eight written rules
The guide covers the inside bar, the outside bar, three inside up and down, rising and falling three methods, the inverted hammer and the broadening formation. Each rule was written before the search and every size in it is in ATR, the average true range of the last 14 sessions. The inside bar needs a mother bar of at least 1.5 ATR and an inside range of at most 60 percent of it. The outside bar needs a range of at least 1.5 ATR and a close beyond the previous bar's range. Three inside up needs a first body of at least 1 ATR, a second body inside it and under 60 percent of it, and a third close above the first open, after a fall.
The inverted hammer needs a body of 5 to 35 percent of the range and an upper shadow of at least twice the body. Three methods needs a first body of 1.2 ATR, three small bodies of at most 0.5 ATR inside its range, and a closing candle beyond the first close. The broadening formation needs swings that widen by at least 1 ATR a step.
What the counts say
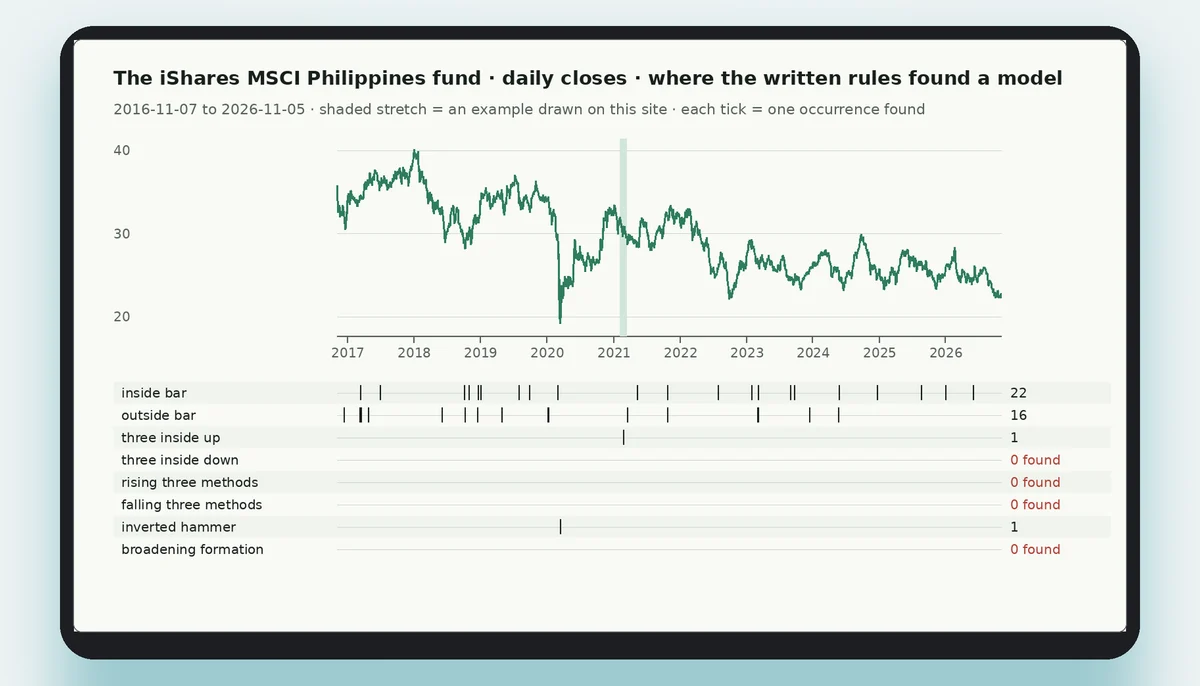
In ten years the rules found 145 inside bars (22 on the fund, 57 on the ADR, 66 on gold), 98 outside bars (16, 29 and 53), one three inside up (on the fund), four inverted hammers (one, two and one), and nothing at all for three inside down, rising three methods, falling three methods or the broadening formation.
The contrast is the point. The first two patterns ask only that one bar sit inside or outside another, and they turn up by the hundred. The last four ask for several conditions in sequence and turn up not at all. A name that sounds as common as the others in a textbook can be an event that three real series did not produce in a decade. The counts do not rank the patterns by usefulness, and they say nothing about what followed any occurrence.
It is also worth reading the instrument split. The PLDT ADR produced the most inside bars of the three, 57, while gold produced the most outside bars, 53. The site does not explain these differences, and a reader should not invent an explanation for them either: they are properties of how three particular series behaved, under rules that were written before anyone looked.
Why a close completes a pattern
Every rule counts a pattern when a closing price completes it. An inside bar counts when it closes, an outside bar when it closes beyond the previous range, three inside up when the third candle closes above the first open, three methods when the fifth candle closes beyond the first close, a broadening formation when a close leaves one of its two lines.
The reason is that a candle still trading may not look like the candle that finishes. An outside bar at midday can end the day inside the range it was breaking. The charts end at or shortly after the completing close, and nothing after it was used in any decision. A reader who acts on a pattern before its close is acting on something that may not exist when the session ends.
For the same reason no chart on this site is cut off before its completing close. A pattern drawn only up to the point where it looks promising would show a reader a success that the rule never certified.
The pages with no chart
Three pages have no chart or only half of one. The three-methods page and the broadening-formation page have none, because rules RM-1, RM-2 and BR-1 found no occurrence on any of the three instruments. The page on three inside up and down draws the up version only, because rule 3I-1 found one occurrence and rule 3I-2 found none.
The site could have loosened the rules until a stretch qualified, or borrowed an example from a better-known market. Either would have put a picture on the page, and neither would have been honest. The finding is narrow: written exactly, these patterns did not occur on these three series between 2016 and 2026. It does not say they never occur elsewhere, and it does not say they mean nothing.
Bars with no range
The source sometimes prints a bar whose high equals its low, an exchange holiday or an empty day filled with one price. Such a bar carries no session. Left in, it would pass for an inside bar and pull down the ATR that every threshold uses. Before any rule runs, bars with no range are removed from the stored history: 77 from gold futures, none from the fund or the ADR.
The step is the same for every rule and happens before any count, so it cannot favour a result. Even so, a nearly flat bar that is not exactly flat stays in, and the page on the inside bar shows one: a session whose range was twenty cents, drawn inside a mother bar of nearly nineteen dollars. It meets the rule and it looks odd, and the page says so.
What a drawn example leaves out
A chart shows one occurrence, the cleanest by the rule's own measure, which is not always the most typical. It leaves out what happened next in any way that could be counted, because counting outcomes needs a definition of success and the site publishes none. It leaves out volume, because the stored history holds open, high, low and close, and it leaves out every time frame except the daily one.
It also leaves out the Philippine index. A reader who wants the PSEi will find it on a platform, not here, and the patterns on these pages should not be read as patterns of the Philippine market. They are patterns on three series the site could read, in dollars.
Where the broker page fits
The site links to one broker, FxPro, from the button in the header and from the call to action at the foot of each page. The link is an advertising relationship: if a reader opens an account through it, the site is paid. The broker page explains in plain words what a contract for difference is and is not and what to read in the terms before an account is opened from the Philippines.
The inside bar, the outside bar and the other six pages can be read without any account; each has its chart, its rule and its count. Placing an order is a separate step with a size, a stop and a take profit, and none of the patterns on this site decides them.
Six patterns, one rule
- Inside barA candle whose whole range sits inside the range of the candle before it, read as a pause before a break.
- Outside barA candle whose range goes beyond both the high and the low of the candle before it, a sign of a wide-ranging session.
- Three inside up and downA harami followed by a confirming candle, turning a two-candle hint into a three-candle statement.
- Rising and falling three methodsA long candle, a short run of small counter-trend candles, and a long candle that resumes the trend.
- Inverted hammerA small body at the bottom with a long upper shadow, after a fall; a potential turn that needs confirmation.
- Broadening formationSwings that get wider, with higher highs and lower lows; a megaphone that signals an unsettled market.
Six models, each found on a real chart
Each card is the stretch of real daily prices on which a written rule found the model, drawn from the history this site keeps for iShares MSCI Philippines ETF, PLDT (US-listed ADR), Gold (COMEX futures). Open a card for the full chart and the rule.
- Inside barGold (COMEX futures) · 13 Nov 2018 – 28 Jan 2019
- Outside barGold (COMEX futures) · 15 Nov 2019 – 23 Jan 2020
- Three insideiShares MSCI Philippines ETF · 12 Jan – 15 Mar 2021
- Inverted hammerGold (COMEX futures) · 31 Jan – 29 Mar 2017
A chart is not an order
The patterns on this site are drawn on real price history, but an order is placed on a trading platform. This site links to an international broker where you can open an account and trade gold, currency pairs and share indices as contracts for difference.